In the competitive landscape of TikTok shop analytics, Kalodata and FastMoss are two platforms offering unique features tailored to different user needs. This article provides a comparison of Kalodata and FastMoss from the perspective of data research and evaluation, focusing on key aspects such as pricing, data accuracy, user experience, and overall functionality.Overview of Kalodata and FastMoss
Kalodata offers robust data visualization features, whereas FastMoss is known for its comprehensive and detailed data reporting. Both platforms are designed to help users gain insights into TikTok trends, shop performance, and creator analytics.

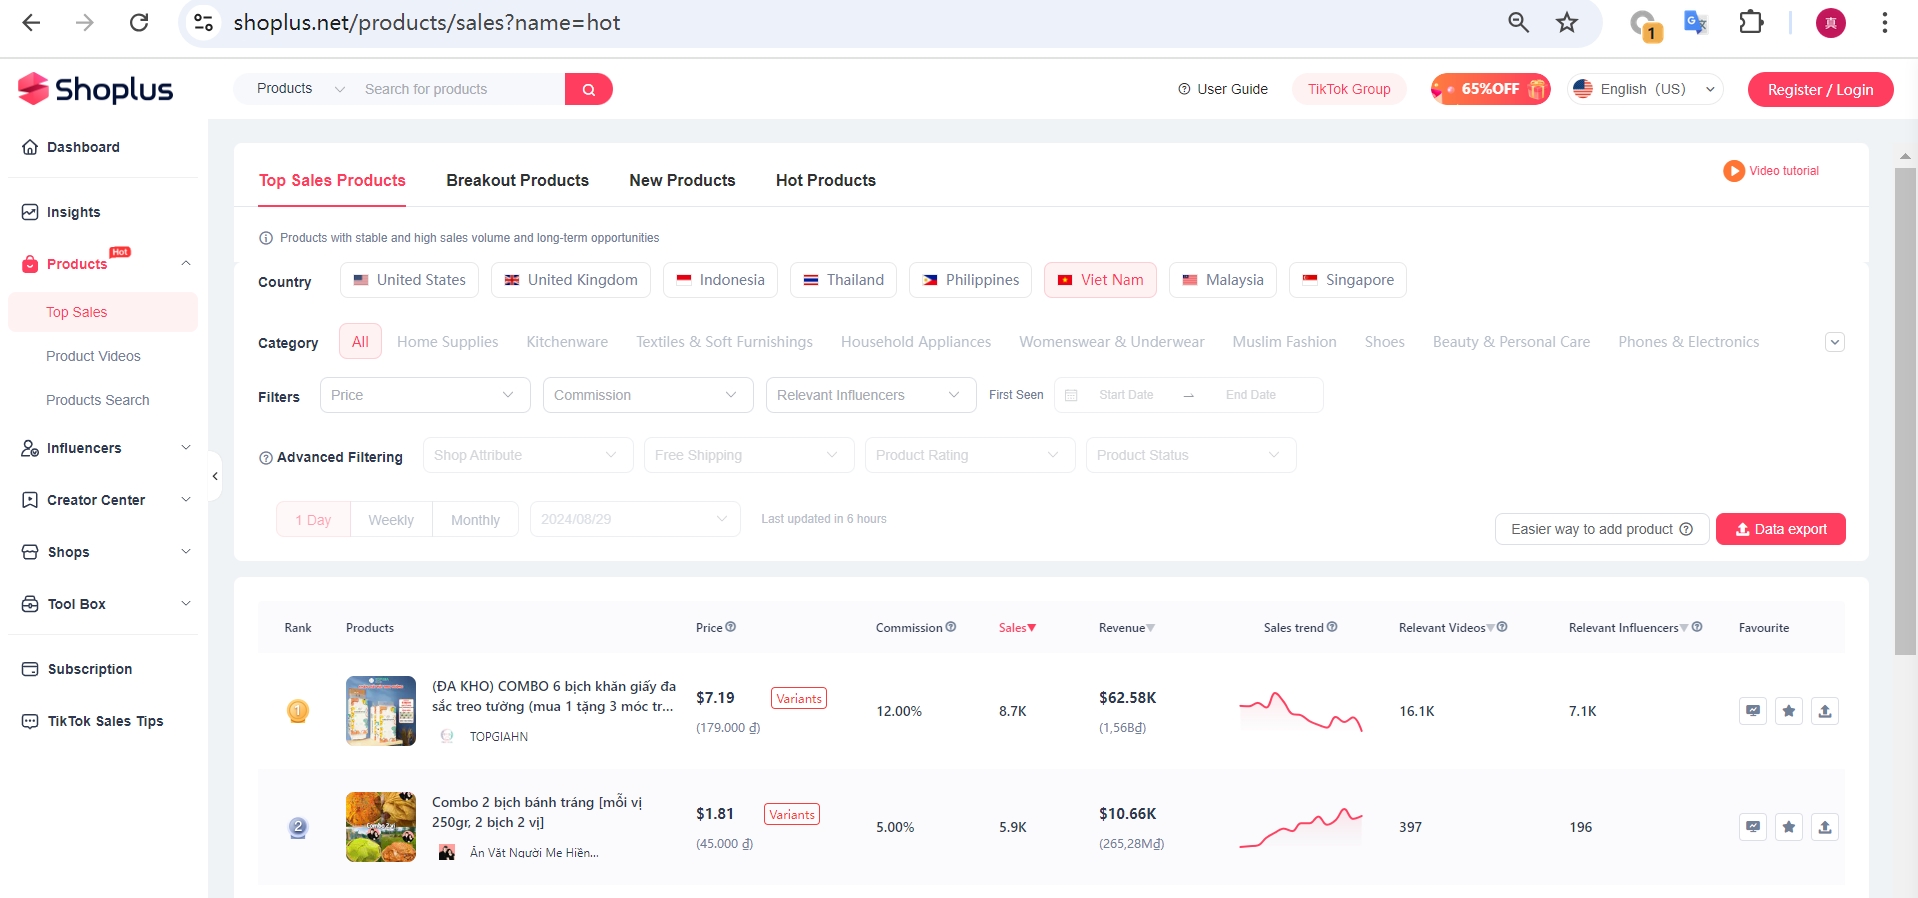
Image source:Shoplus-Top Saies Products
Pricing
Kalodata offers tiered pricing options that make it accessible for a range of users. Typically, the basic plan is more affordable compared to FastMoss, which can be advantageous for users seeking cost-effective solutions. FastMoss, on the other hand, provides a range of plans that cater to different needs, though its entry-level option is generally priced higher than Kalodata’s.
Data Accuracy
Both Kalodata and FastMoss offer valuable insights, though neither can guarantee complete accuracy. Achieving 100% data accuracy is challenging without an official TikTok analytics tool. While both platforms provide directionally accurate information, users may encounter discrepancies in shop, creator, and product rankings. It is advisable to use these tools alongside direct TikTok data for a more comprehensive understanding.
User Experience
Kalodata is known for its intuitive user interface and streamlined design. The platform features an easy-to-navigate dashboard, drag-and-drop functionality, and customizable templates. This user-friendly approach makes Kalodata suitable for those who prefer a simpler, more straightforward experience.
FastMoss, by contrast, offers a more detailed and expansive set of features. While its interface provides extensive data and filtering options, it can initially feel overwhelming. The platform’s more complex design may appeal to users who require detailed analytics and are comfortable navigating a more intricate system.

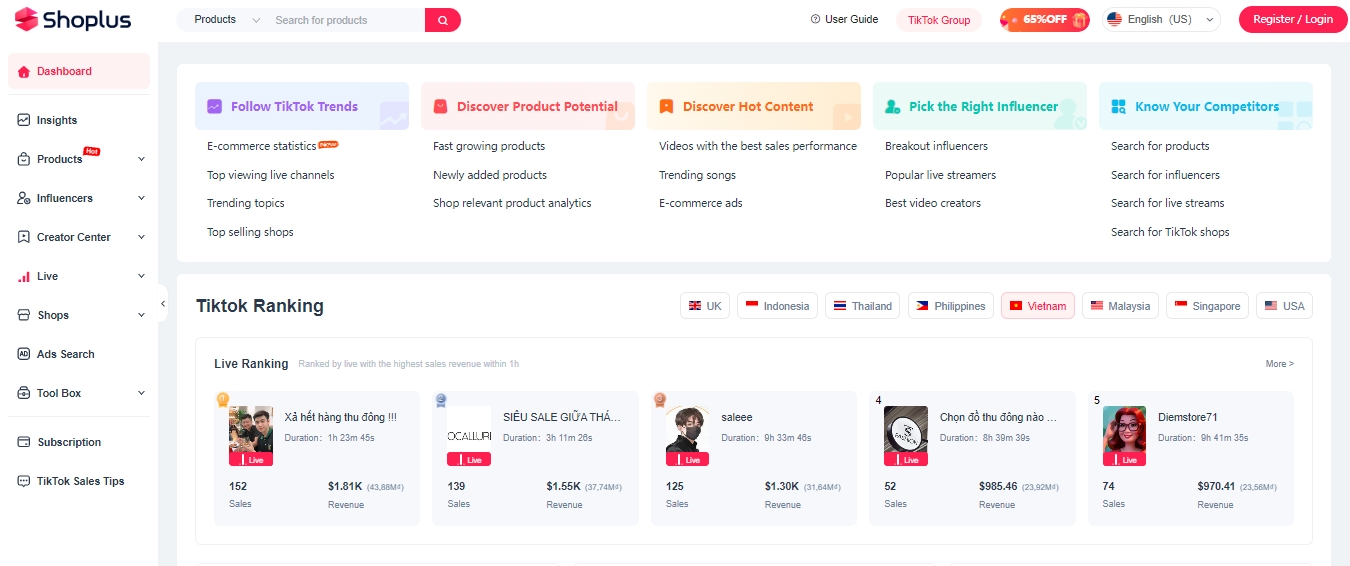
Image source:shoplus.net
Data Visualization and Features
Kalodata is noted for its strong data visualization capabilities, offering interactive dashboards, a diverse array of charts and graphs, and advanced tools for geospatial and predictive analytics. Its features like real-time data synchronization and smooth data integration make it well-suited for users who require dynamic and actionable insights.
On the other hand, FastMoss provides comprehensive data reporting with a focus on detailed metrics and analytics. Although it offers extensive data, its visualization tools are generally less flexible compared to Kalodata. Users who emphasize in-depth reporting and detailed metrics might find FastMoss to be more aligned with their needs.
Collaboration and Sharing
Both platforms offer features to support collaboration and data sharing. Kalodata includes options for team collaboration, version control, and secure data sharing, which can be beneficial for organizations working in a collaborative environment.
FastMoss also supports team functionality but may not offer the same level of ease in collaboration due to its more complex interface. Sharing options are available but may require more navigation compared to Kalodata’s straightforward approach.
Security and Compliance
Both Kalodata and FastMoss take security seriously, employing encryption protocols and adhering to compliance standards. Users can trust that their data is protected with industry-standard measures, though specifics may vary between the two platforms.
Conclusion
Both Kalodata and FastMoss offer valuable capabilities for TikTok analytics, each with its own set of strengths and potential limitations. Kalodata is noted for its user-friendly design and effective data visualization tools, making it a practical choice for users who value ease of use and intuitive insights. In contrast, FastMoss excels in providing detailed and extensive reporting, catering to those who require in-depth data analysis. Ultimately, the choice between these platforms will depend on individual needs and preferences. Users should consider their specific requirements and analytical goals when selecting the most suitable tool for their TikTok analytics needs.

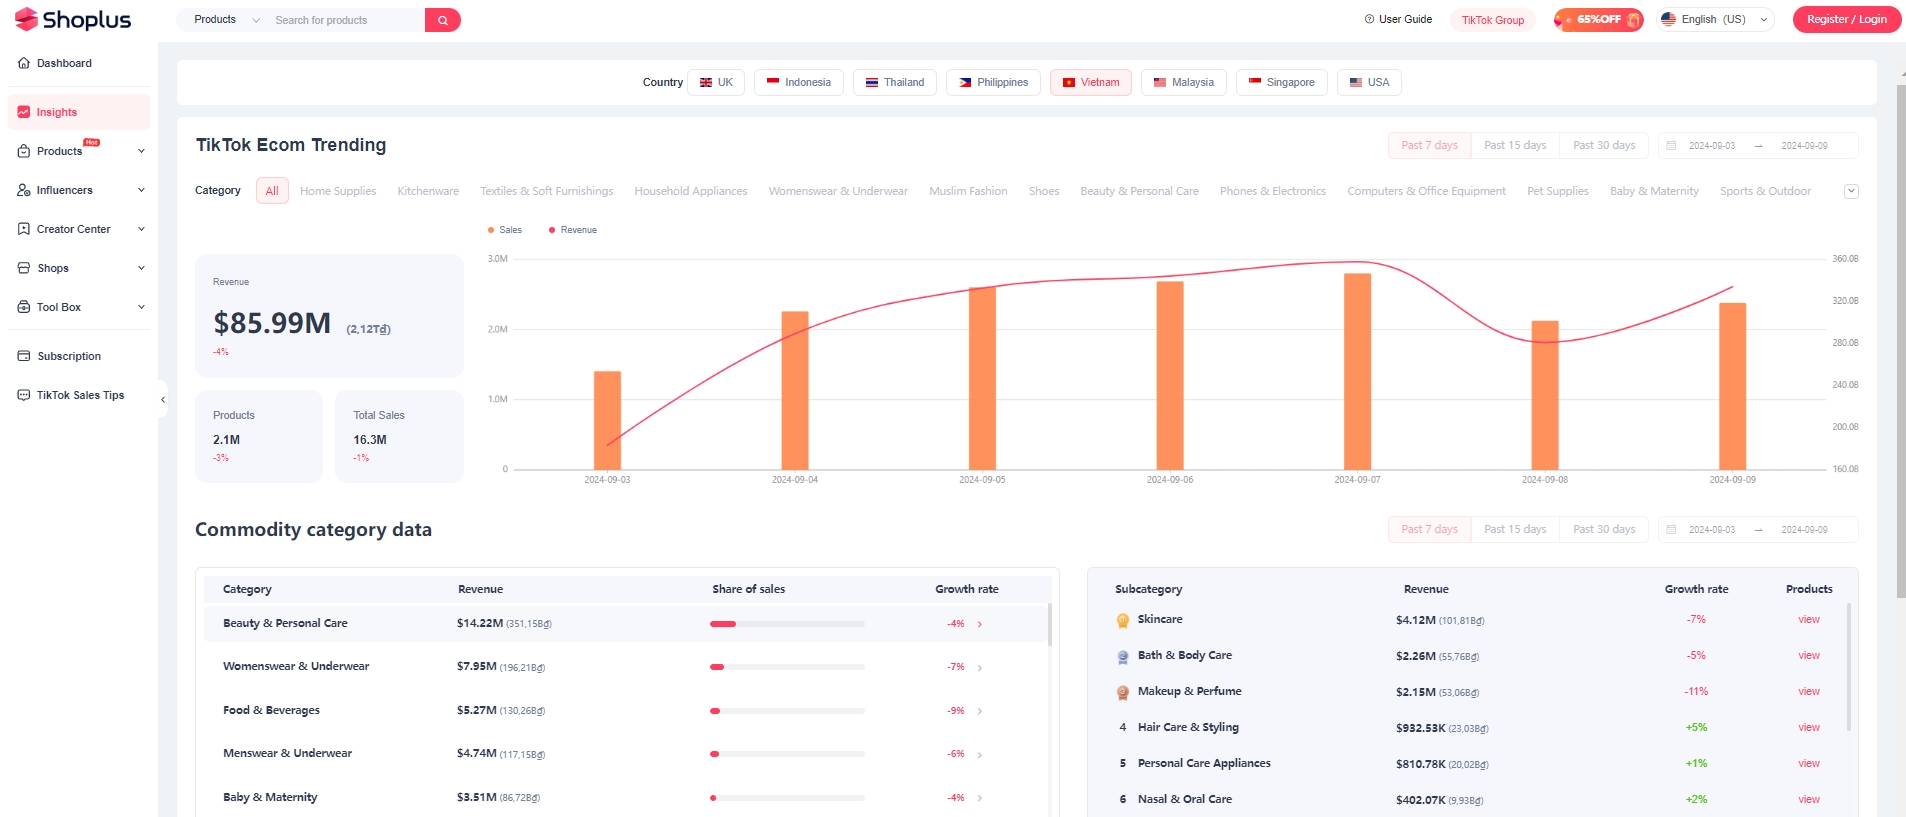
Image source:Shoplus-Insights
For those looking to explore TikTok data further, Shoplus provides its own robust analytics solution. Shoplus offers a comprehensive range of features for tracking TikTok trends, analyzing shop performance, and evaluating creator impact. Additionally, Shoplus stands out for its competitive membership pricing, delivering high value for its cost. This makes Shoplus an attractive option for users seeking effective analytics at a more affordable price point.