Since its launch in 2017, TikTok has been rapidly developing and is approaching the dominant position of old-school social media platforms such as Instagram. It is a traffic pool that cross-border sellers cannot ignore. As a seller, learning TikTok e-commerce data analysis can help us operate better. Today, we will explain how to check analytics on TikTok.

Switch to a TikTok Pro Account
To use TikTok's data analysis function, we should first upgrade the default PA account to a Pro account. Similar to Instagram's profile, TikTok's Pro account also has the advantage of allowing brands and creators to monitor their audience and content. The specific steps are:
first click the three dots in the upper right corner of the profile, then select "Manage my account" and click "Pro account", and finally select your account type and brand category. After setting it up, the TikTok account will be converted to a Pro account.
Learn to View TikTok Analytics
From the moment you switch to a TikTok Pro account, TikTok's backend starts displaying data analysis, which can be viewed via a computer or mobile phone. To view it on a computer, simply click on TikTok Analytics on the desktop, hover the mouse over "Profile", and a small window will appear. Click again to view the analysis. To view it on a mobile phone, click the three dots in the upper right corner of "Profile", access the "Settings and Privacy" option, and then click "Analytics" under "Account" to view the data analysis.
Common Metrics for Data Analysis
On the "Analytics" page, we can generally see three metrics: Profile Overview, Content Data Analysis, and Fan Data Analysis. These metrics allow us to know the number of likes, comments, growth data of fans, and the number of views of the profile, etc.
Generally speaking, the longer the account activation time, the more accurate the data analysis.
1) Video Views
The first tab on the "Profile Overview" is the number of video views. This data generally represents the total number of times videos were watched on TikTok.
2) Number of Fans
The second tab on the "Profile Overview" is "Fan Data," which generally displays the total number of fans and new followers in the past 7 to 28 days.
3) Profile Views
Clicking on this data displays the number of times your profile was viewed in the past 7 to 28 days. Through this data, creators can understand which content is more attractive to users.
4) Total Video Views
Clicking on "Videos" under "Content Data Analysis" displays all of the creator's videos and the total number of views the videos received in the past 7 days.
5) Trends
Clicking on "For You" under "Content Data Analysis" displays the cumulative number of views of the creator's videos and the trend of the videos.
It should be noted that the video view count is limited in time, generally within a week. The popular video section can display data from 7 days ago, which helps us determine trends and create more popular videos.
6) Analyzing a Single Video
If you want to know the specific data of a single video, you need to click on the thumbnail of that video. Then a new page will appear, and you will see various indicators of the video, such as the total number of views, total playing time, audience demographics, traffic sources, etc. Through this data, we can understand the direction of content creation and deepen our understanding of the audience, thereby creating better videos.
7) Fan Data Analysis
On this page, clicking on "Fans" shows the total number of your fans. Clicking on "Gender" allows you to know whether your audience is more inclined towards males or females. Clicking on "Popular Regions" shows which areas or countries your followers are more inclined to. Clicking on "Fan Activity" shows what time your fans usually watch your videos, which helps you determine when to publish videos.
8) Tag Views
Clicking on "Tag Views" shows the number of times audiences searched for specific topic tags. Through this tag, you can understand the related topic tags and the popularity of using topic tags.
9) Average Engagement Rate
Generally speaking, the average engagement rate = ((number of likes + number of comments) / number of fans) * 100. This value can show the popularity of your videos.
10) Total Likes
Clicking on the "Total Likes" tab shows the total number of likes for all your video content, similar to the total number of likes on Douyin. Through this indicator, you can understand the degree of fan appreciation and your video creation ability.

How to check analytics on tiktok
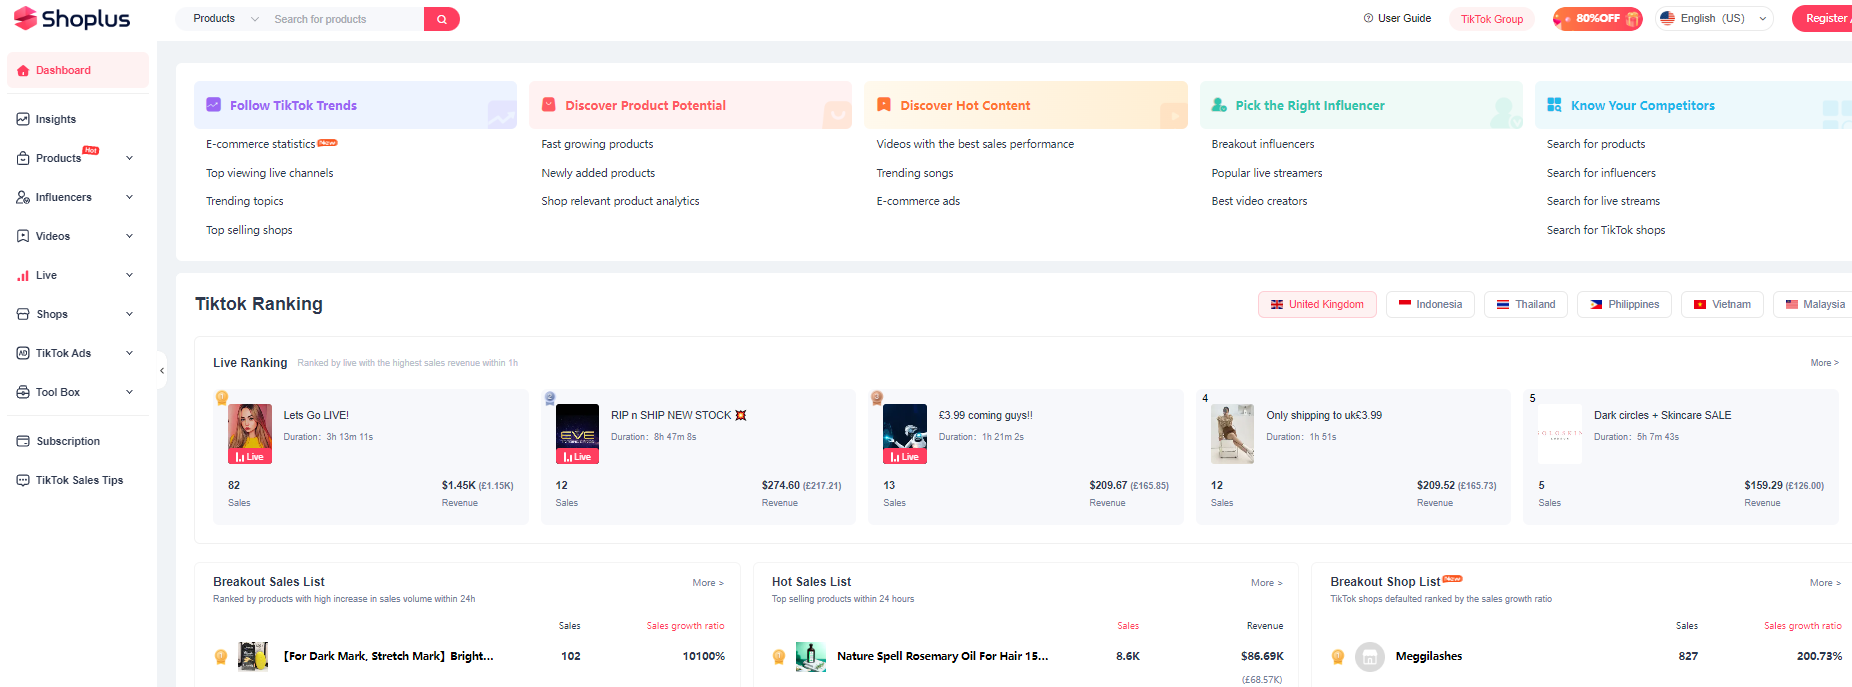
To obtain TikTok data, you first need the support of relevant data platforms. Different platforms have different advantages. Shoplus, for example, has a significant advantage. It not only provides data on the product selection of tens of thousands of players on TikTok but also allows you to compare accounts and view TikTok data analysis, including TikTok Shop's popular store rankings, TikTok for Business advertising analysis, TikTok Creator influencer analysis, popular bloggers, popular videos, popular topics, popular music, etc.
If you want to succeed on TikTok, data analysis is a must. This can help you grow and make money quickly. I hope these tips are helpful to you, and wish you success!
>